Budget view
Read your budgets by category, see what's left, and let the daily number guide your spending.
Opening the budget view
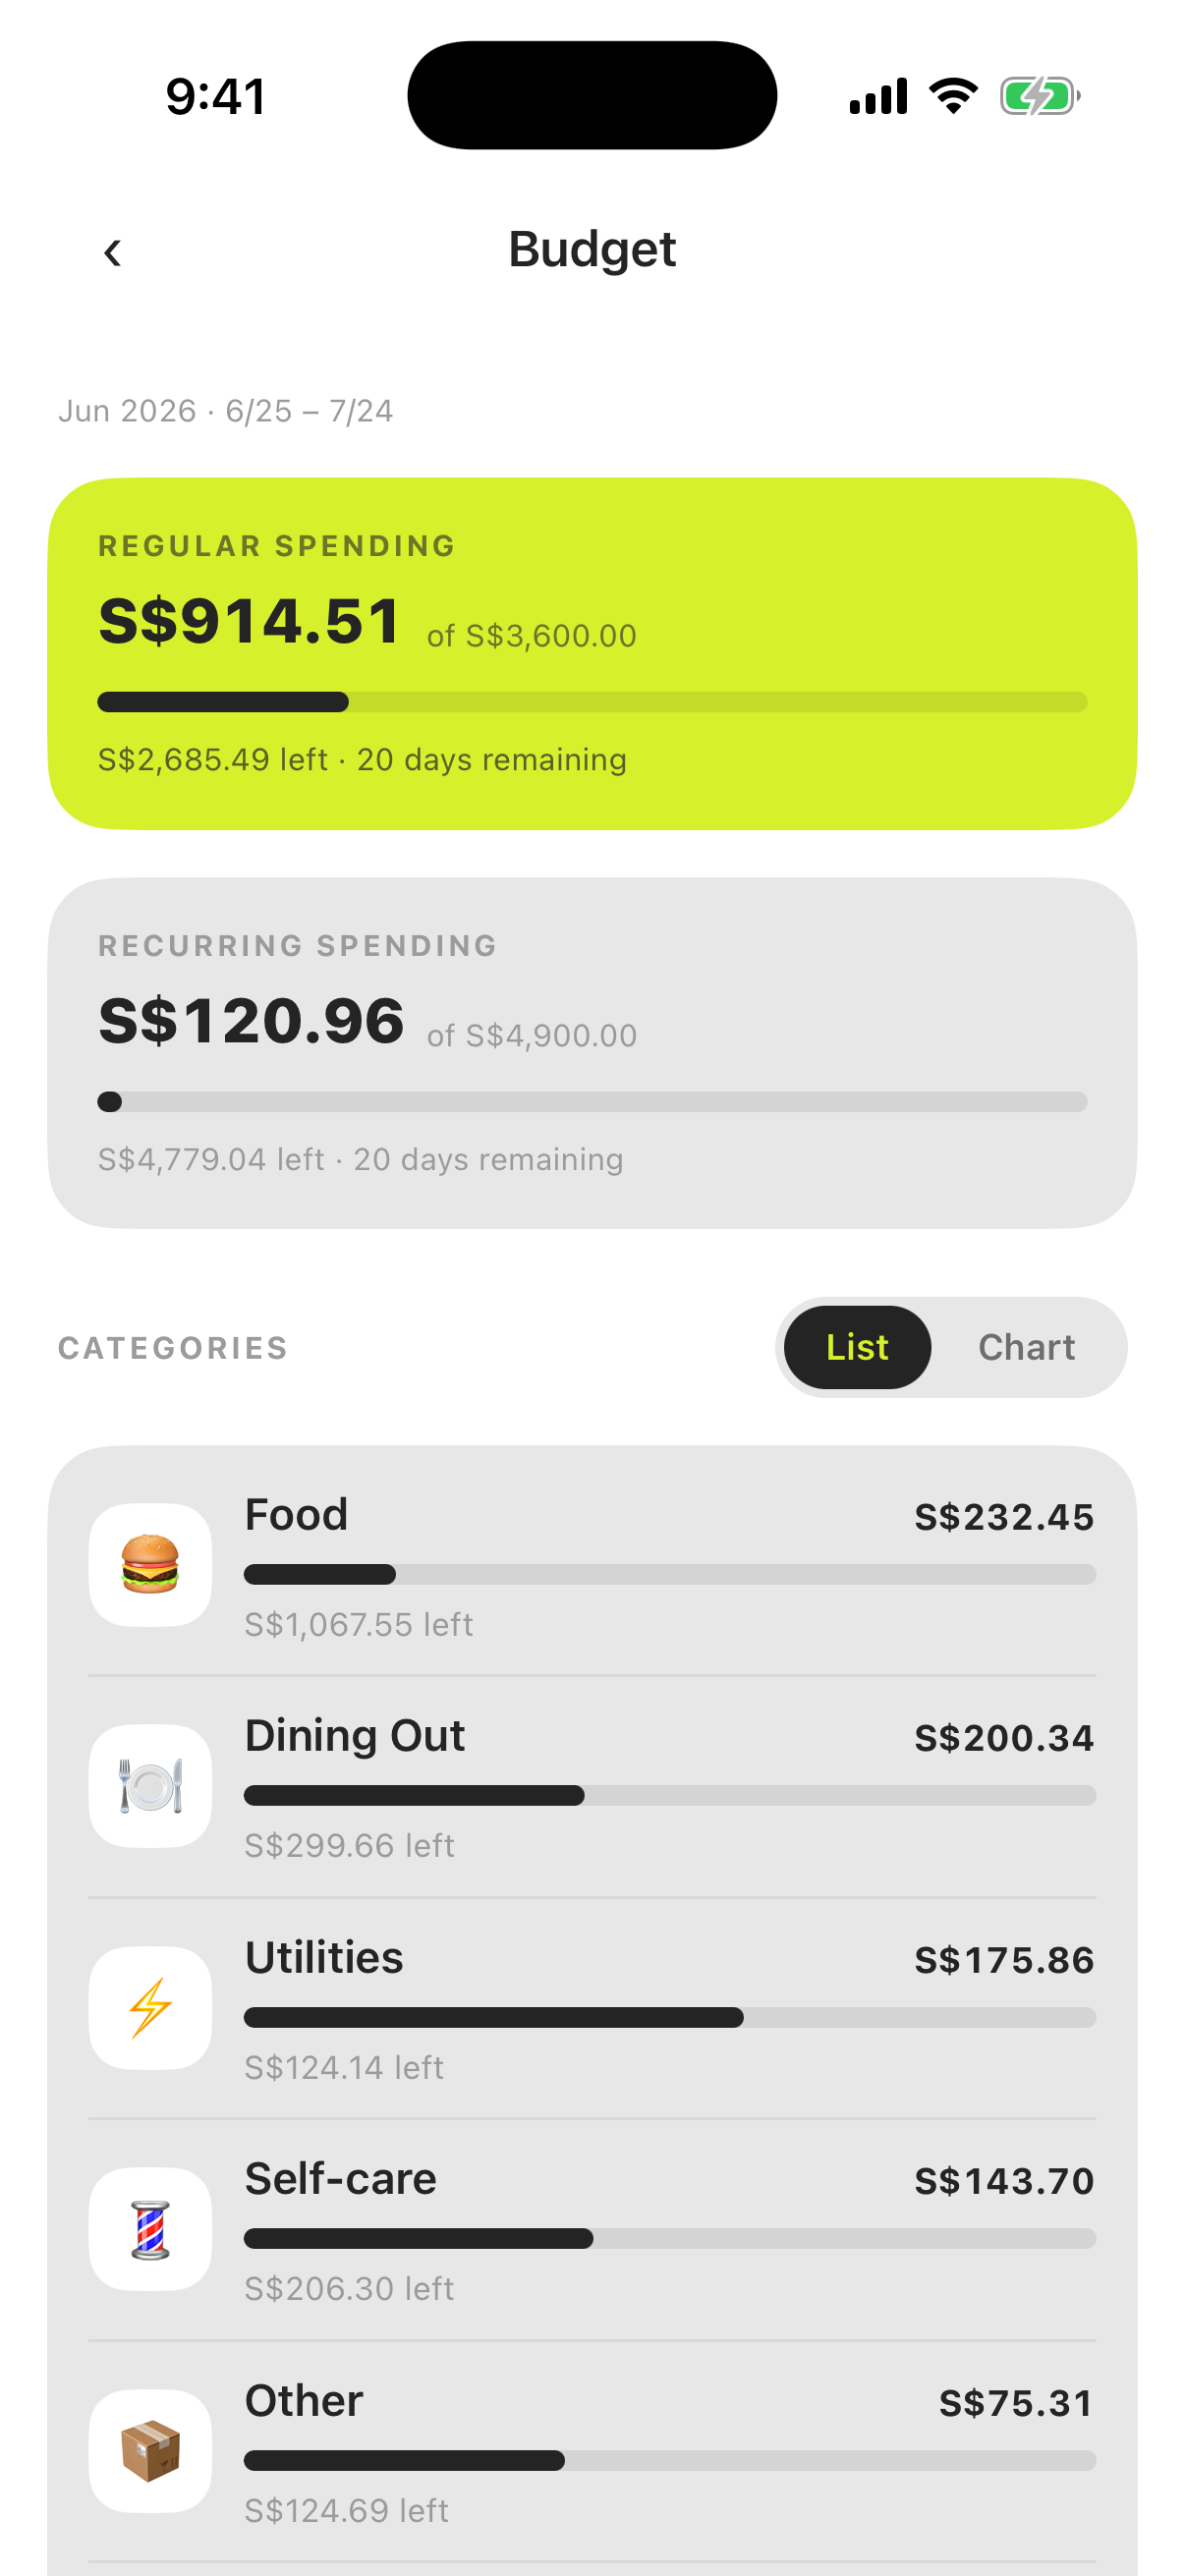
Tap the summary card on the dashboard, or tap the Spent chip in the income/expense summary. A Spending / Income toggle sits at the top of the screen so you can flip between the two breakdowns at any time. Spending mode shows both envelopes side by side:
- Regular spending — everyday variable expenses (food, transport, fun).
- Recurring spending — fixed monthly bills, set aside before the month begins.
Each shows spent vs allocated with a progress bar. The bar turns red when a budget goes over — no judgment, just clarity.
Per-category breakdown
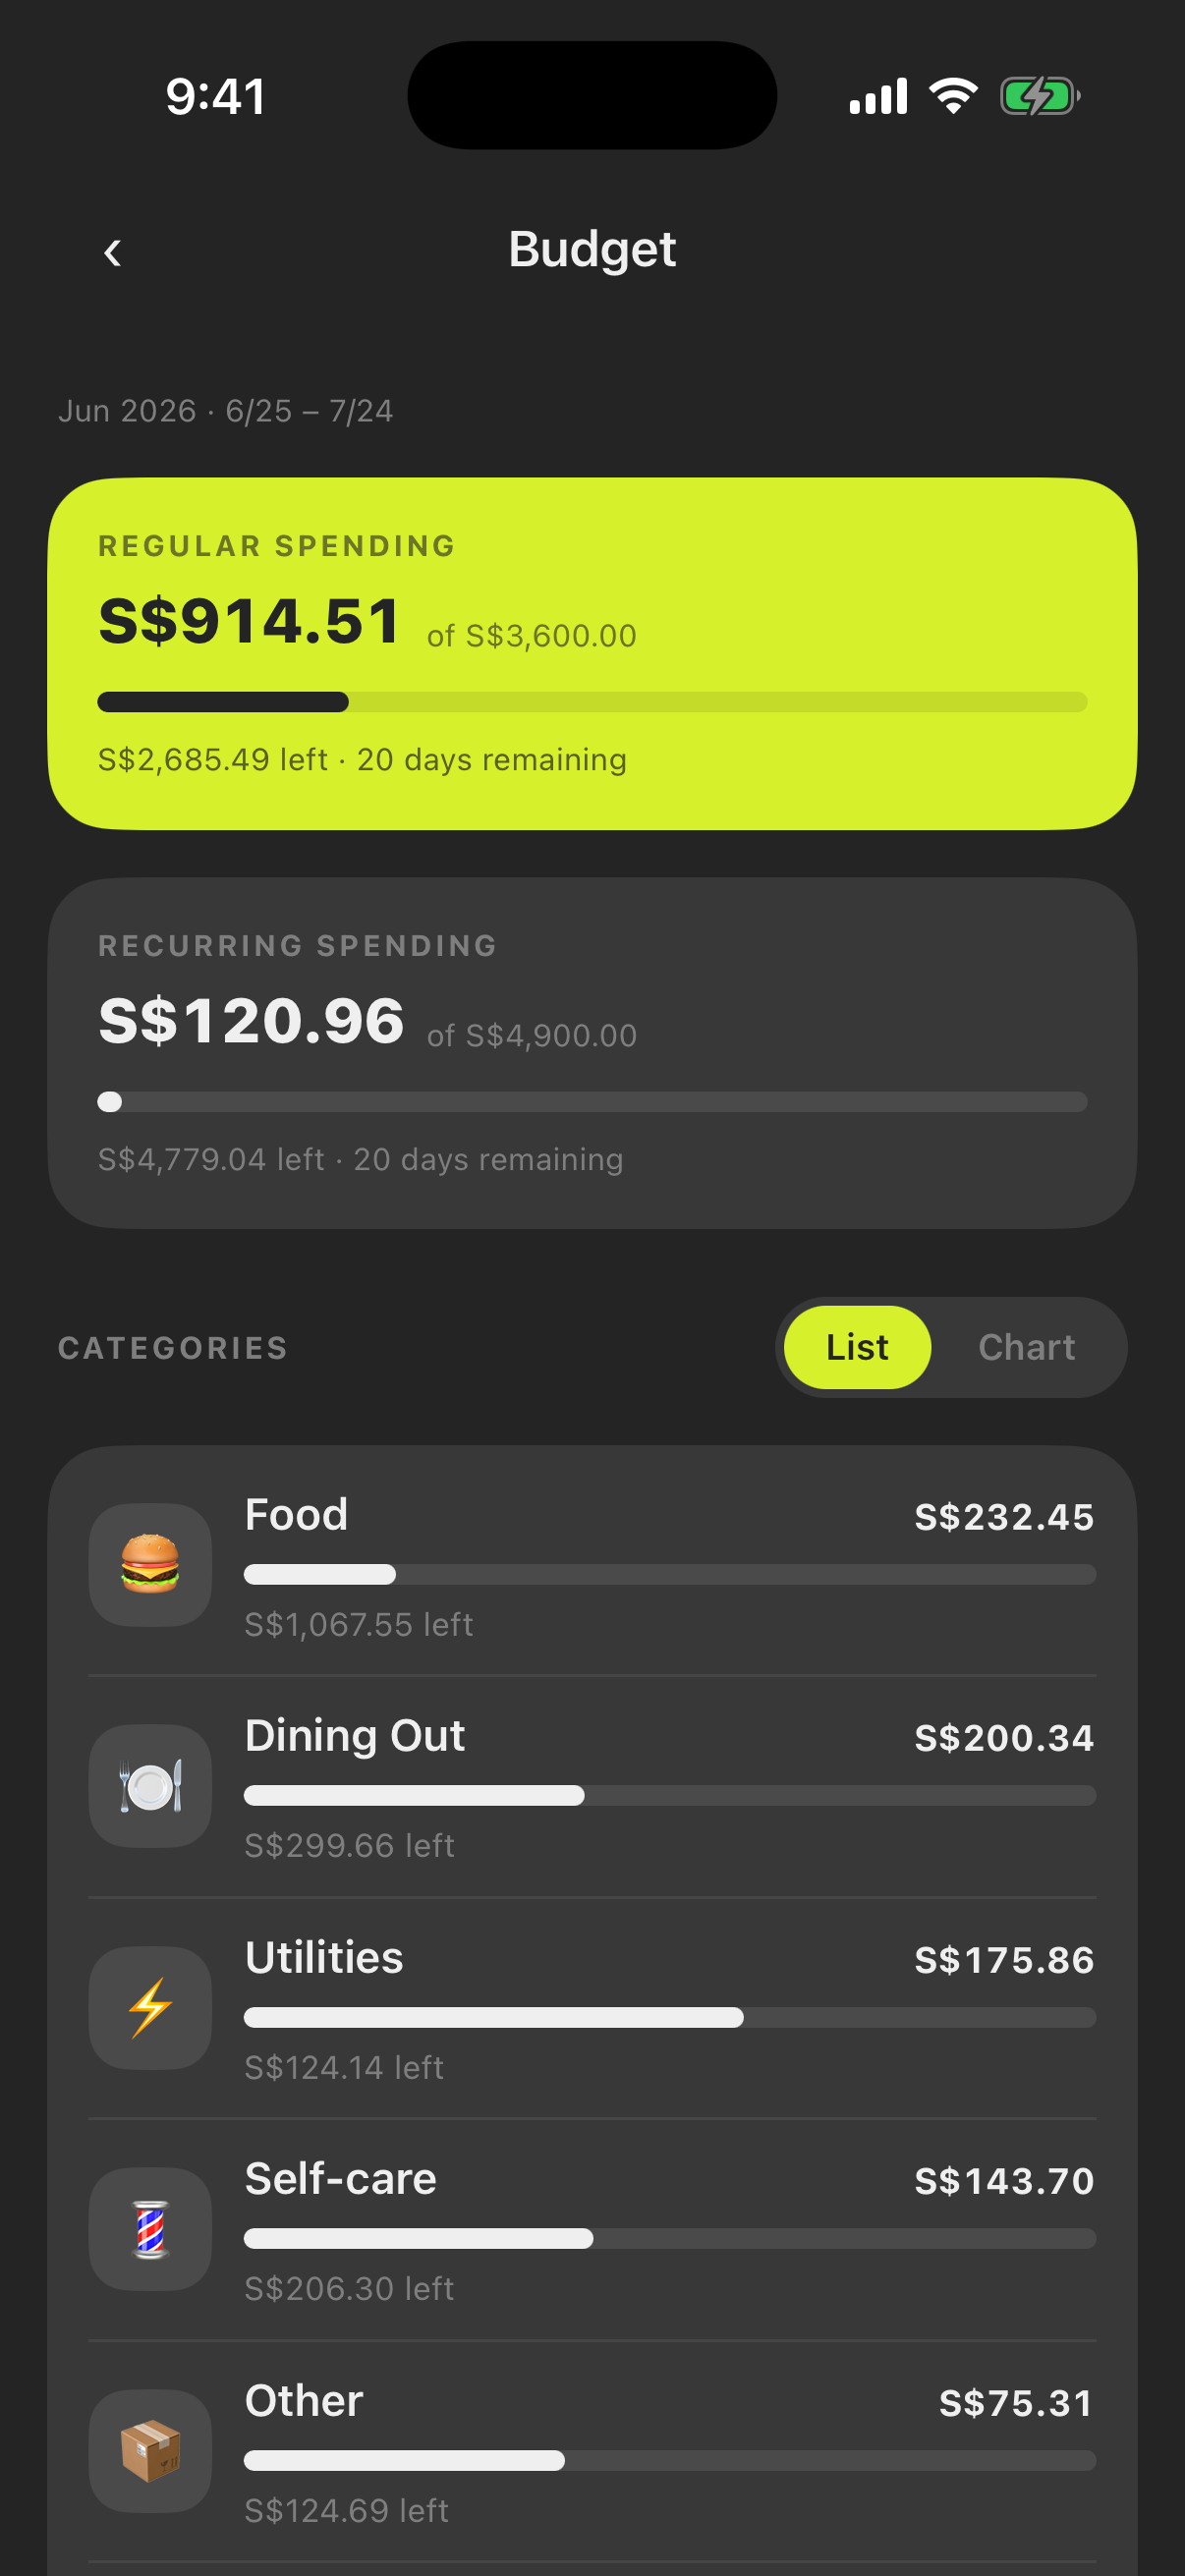
Below the envelopes, every category gets its own row: spent, allocated, and what’s left. Tap a category to drill into its category detail — all of its transactions for the period plus its own progress bar.
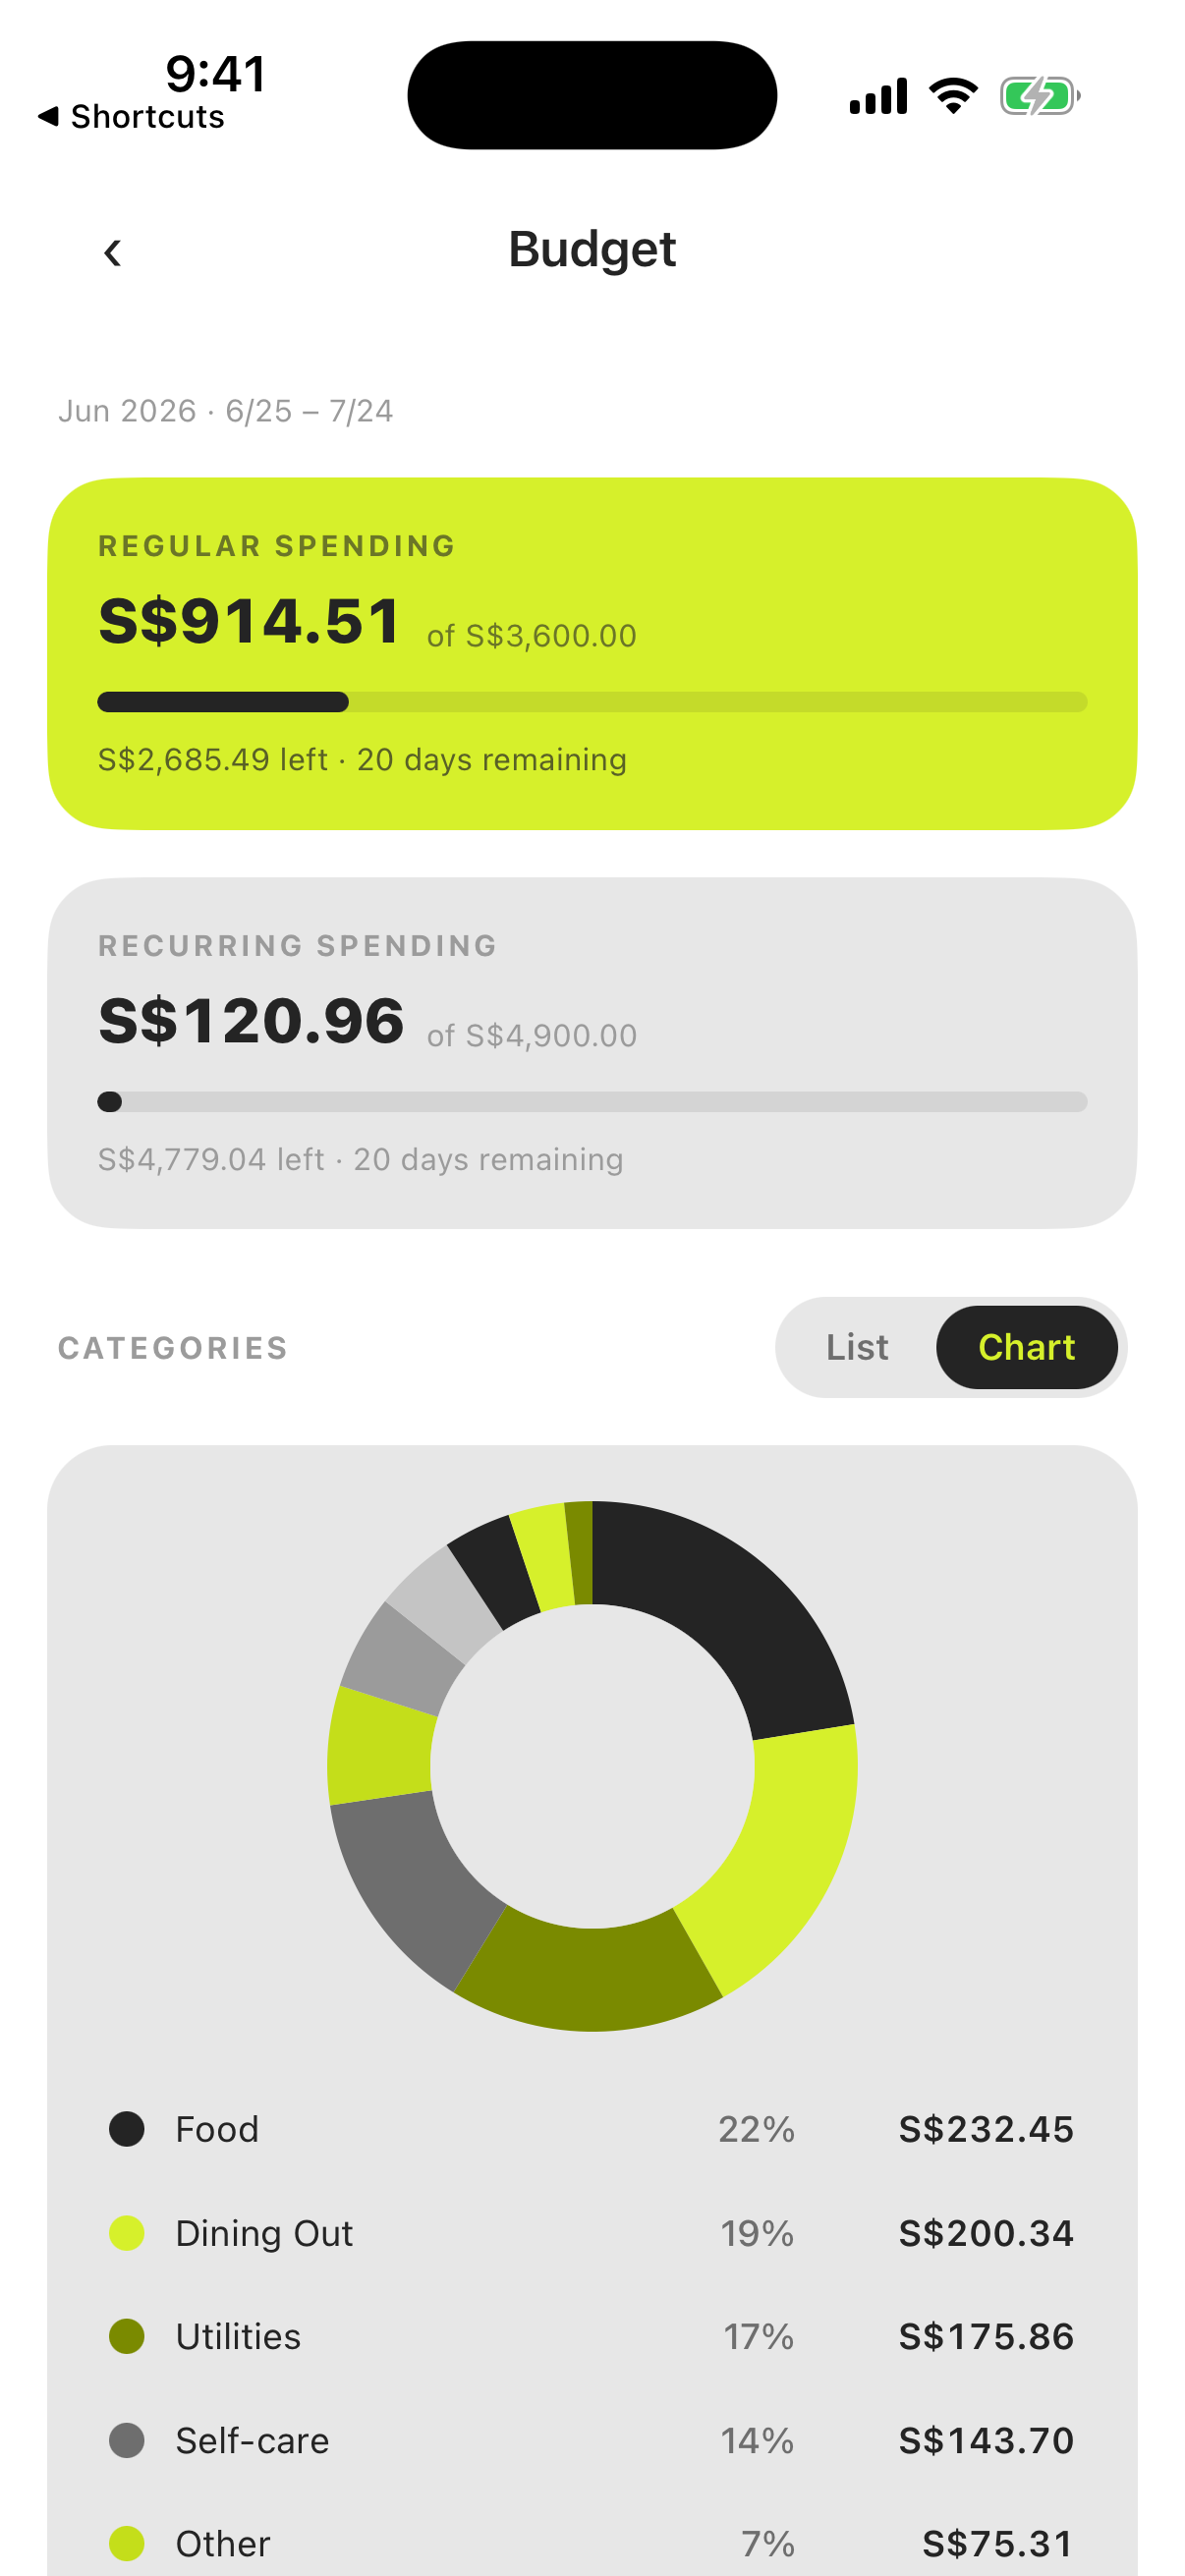
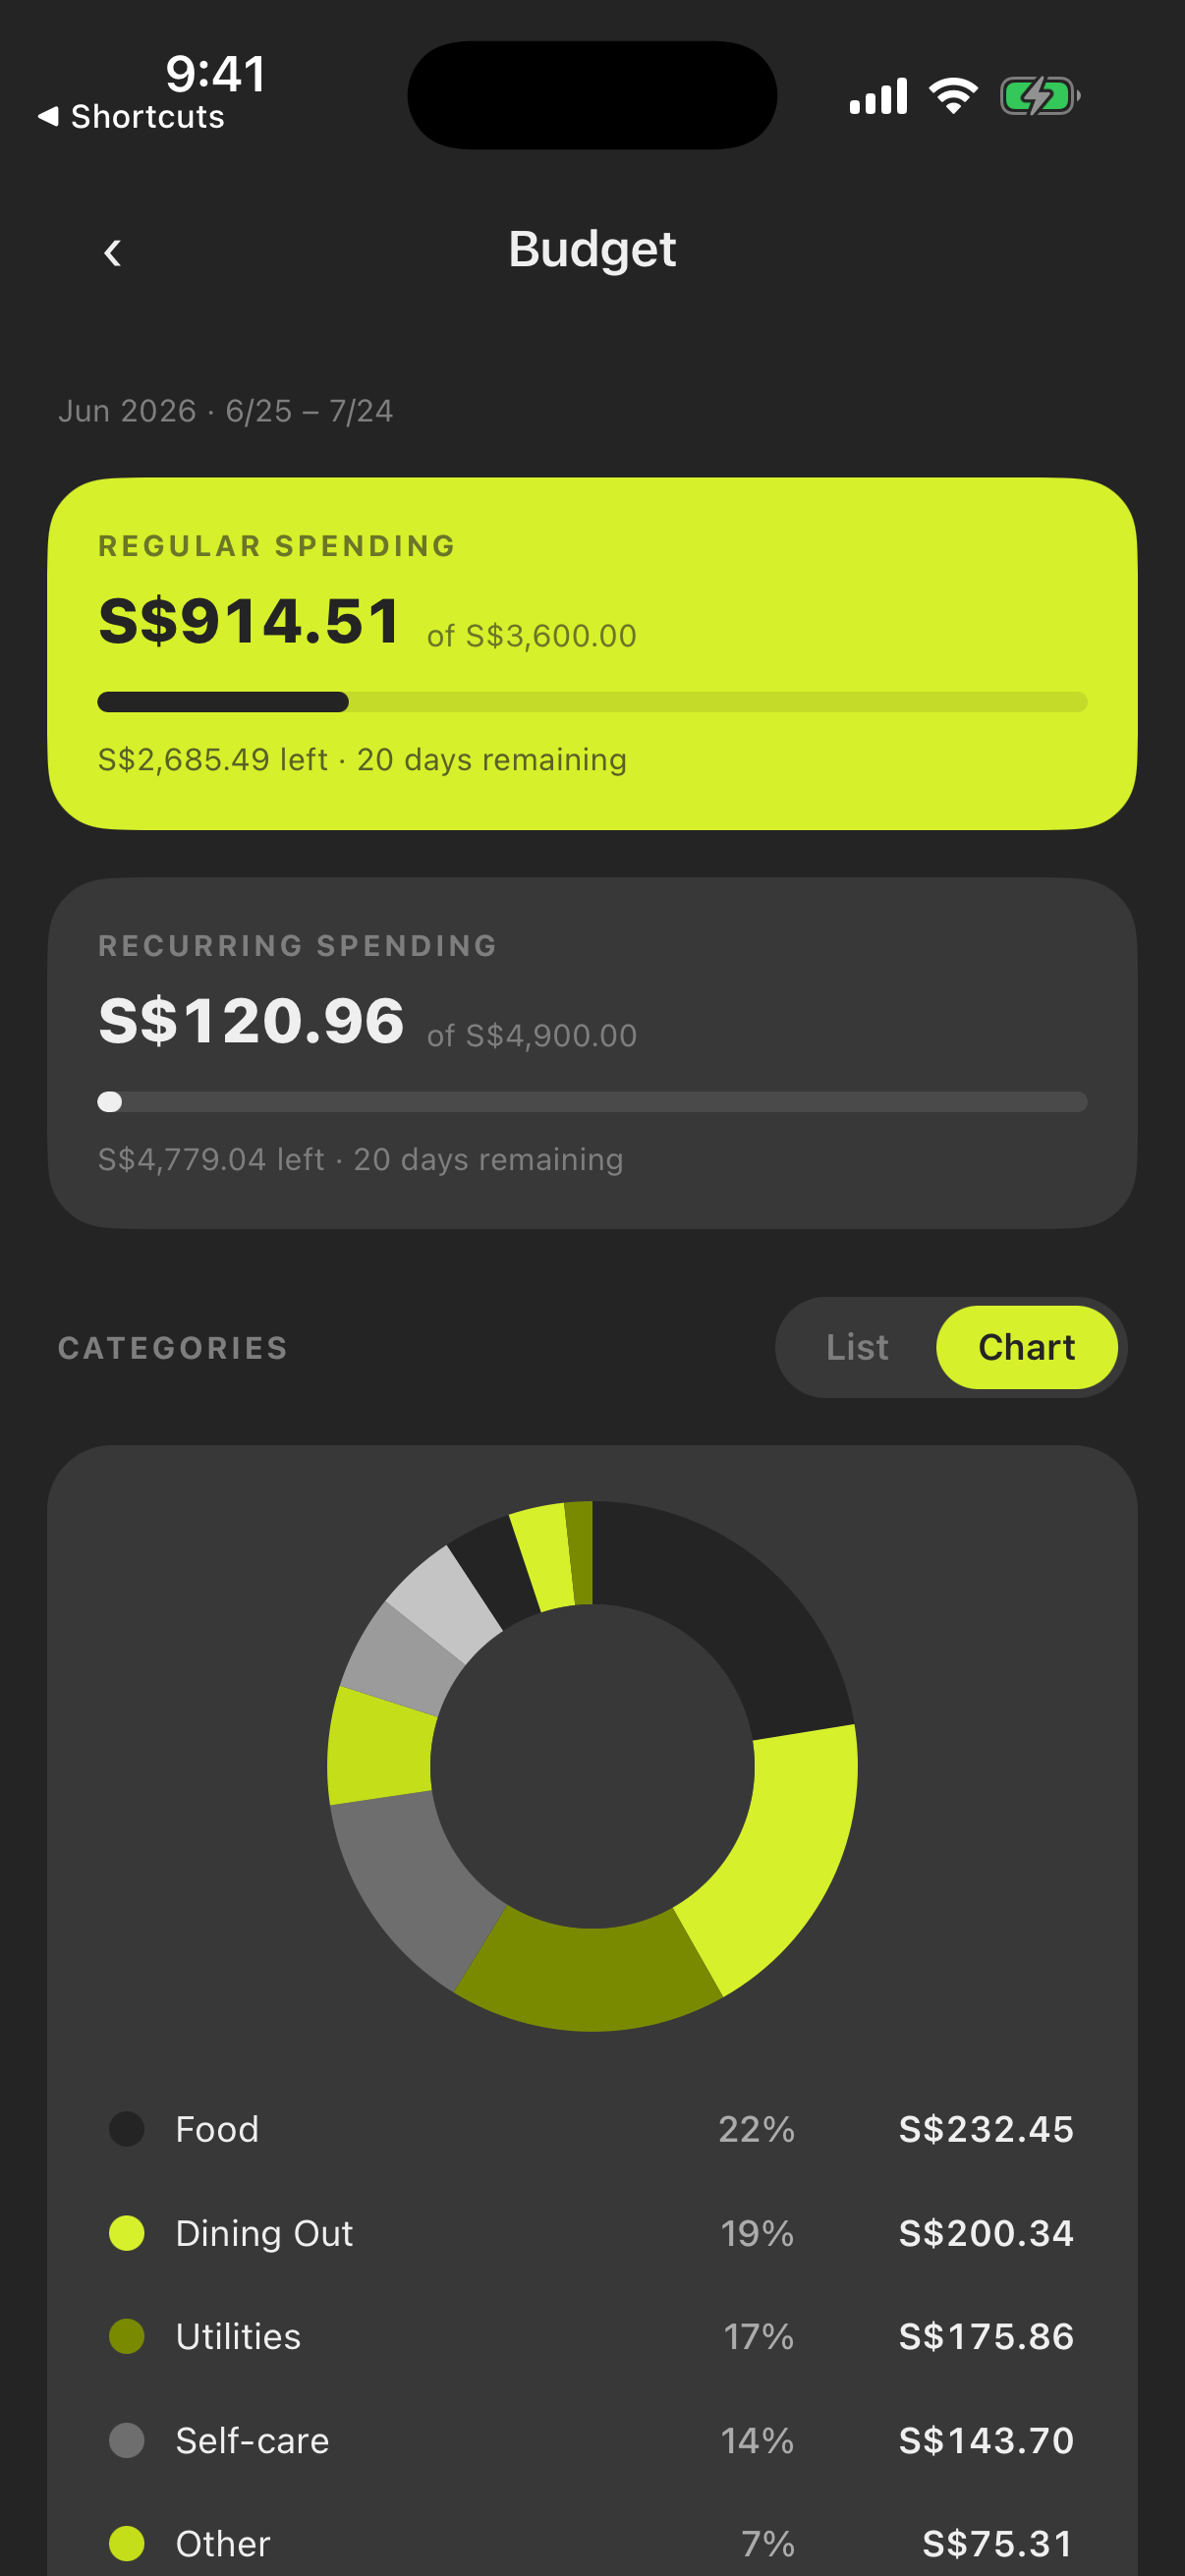
Prefer a bird’s-eye view? Switch List to Chart to see the same categories as a donut — each slice sized by its share of your spending, with the percentage and amount beside it. Swipe between both below.
Leftover and the daily number
The headline stat is what’s left — allocation minus spending, per envelope and per category. From the regular envelope’s leftover, Monivera computes a suggested daily spend: what’s left divided across the days remaining in the period.
This number is accurate precisely because the budget is split: recurring bills are funded from their own envelope, so rent hitting mid-month never distorts your daily pace — the daily number only ever reflects money that’s genuinely free to spend.
That’s the number to live by. Over it today? Tomorrow’s number adjusts down. Under it? Tomorrow gets roomier. Either way you always know where you stand without doing math in a grocery aisle.
Income breakdown
Flip the toggle to Income (or tap the Income chip on the dashboard) to see where the period’s money came from. A Total received card sits on top, and below it every income category gets a row with its amount — largest earners first. Income carries no allocation, so there are no envelopes, targets, or progress bars here; just what came in.
Switch List to Chart for the same categories as a donut, sized by each source’s share of your income. Tap a category to open its detail — its received / share / count stats plus every income transaction behind it. Income with no category is grouped as Uncategorized and isn’t tappable.
Periods
The budget view always shows the current cycle, anchored on your household’s budget start day. Use the period banner to look back at previous cycles and see how your months compare.